我有 12 份帳單文字檔,每份 30–40 筆。手動整理是可以,但我不想重複做同樣的事超過一次。
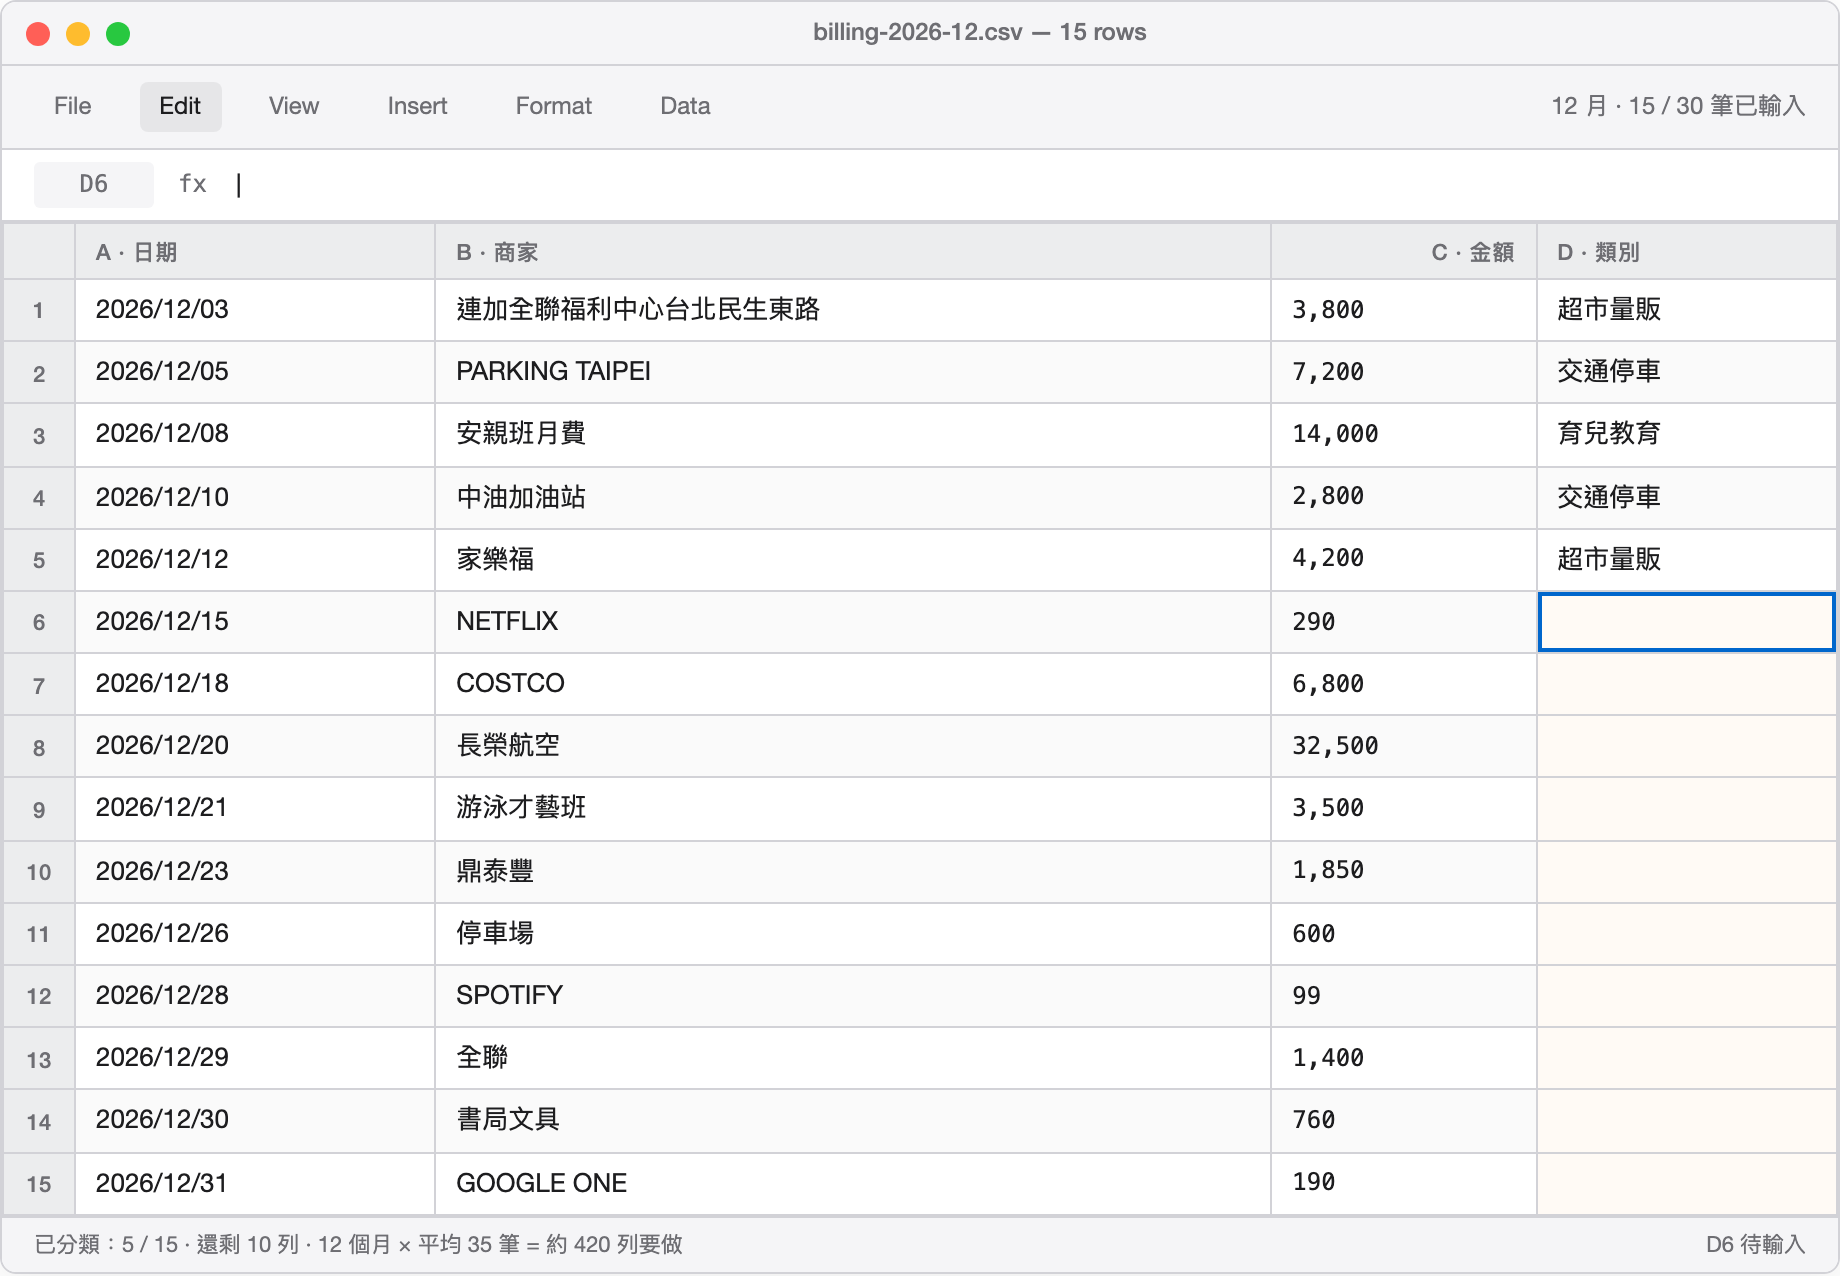
12 個月 × 平均 35 筆 = 約 420 列要分類。這就是「手動是可以」實際長什麼樣——一格一格按下去、想一下這家是什麼類別、輸入、Enter、下一格。我更不想把這份帳單 PDF 傳到任何雲端 AI——裡面有商家名稱、金額、消費時間,足以拼出家庭的完整消費習慣。
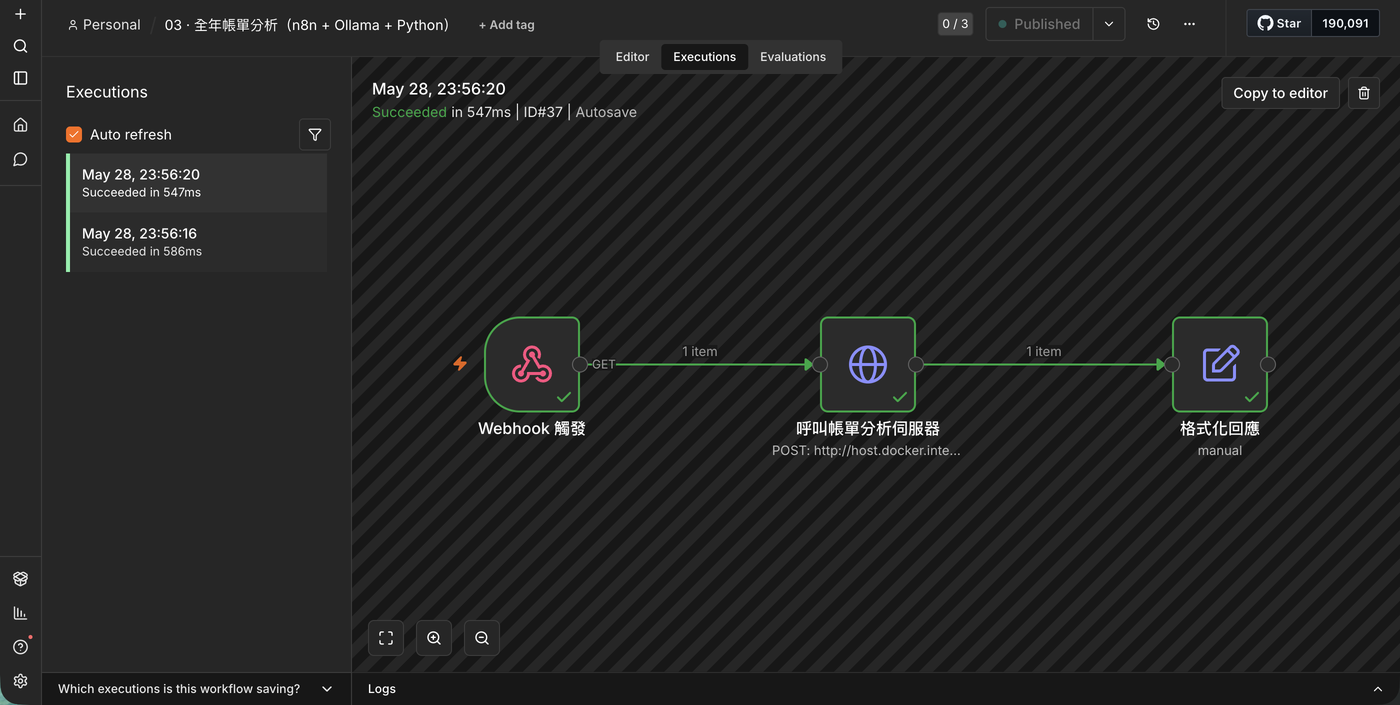
所以我花了一個下午,用 n8n + Python + Ollama 搭了一個全自動分析流程。按一次 webhook,三分鐘後拿到一份有圖表的 Excel,順帶附上 AI 對每個月的消費摘要。
這篇記這個流程怎麼設計的、踩到哪些坑,還有數字告訴我的那幾件事。
I had 12 months of credit card statements as plain-text files, 30–40 entries each. Manual sorting was possible, but I wasn't going to do the same thing twice.
12 months × ~35 entries each = ~420 rows to categorize. That's what "manually doable" actually looks like — one cell at a time, think about which category this merchant fits, type, Enter, next cell. And I definitely wasn't uploading those files to a cloud AI — merchant names, amounts, timestamps are enough to reconstruct a family's entire spending profile.
So I spent an afternoon wiring together n8n + Python + Ollama into a fully automated pipeline. One webhook trigger, three minutes later: a categorized Excel file with charts, plus an AI-written monthly summary for each of the twelve months.
This is how the pipeline works, where it broke, and what the numbers said.
架構:三層分工
整個系統分三層,分工很清楚:
n8n Webhook
    ↓
Python Flask 端點(解析 → 分類 → Ollama → Excel)
    ↓
回傳 JSON 給 n8n
n8n 是指揮:負責接收觸發請求、呼叫 Python 端點、把結果格式化後回傳。Workflow 只有三個節點,5 分鐘搭完。
Python Flask 是苦工:解析帳單文字檔、做關鍵字分類、呼叫 Ollama 分析每個月、最後用 openpyxl 生成 Excel。這邊是真正的邏輯所在。
Ollama 負責說人話:把每個月的消費數據餵進 gemma4:e2b,請它用 80 字講出這個月的消費特色、值得注意的支出、一個建議。
Architecture: three layers, one job each
n8n Webhook
    ↓
Python Flask endpoint (parse → classify → Ollama → Excel)
    ↓
JSON back to n8n
n8n is the conductor: receives the trigger, calls the Python endpoint, formats the response. Three nodes total. Five minutes to build.
Python Flask does the actual work: parses the statement files, runs keyword classification, calls Ollama for each month's summary, generates the Excel with openpyxl. All the real logic lives here.
Ollama translates numbers into sentences: each month's spending data goes into gemma4:e2b with a prompt asking for an 80-character summary — the month's notable characteristic, one thing worth watching, one recommendation.
n8n 的部分:三個節點
n8n workflow 長這樣:
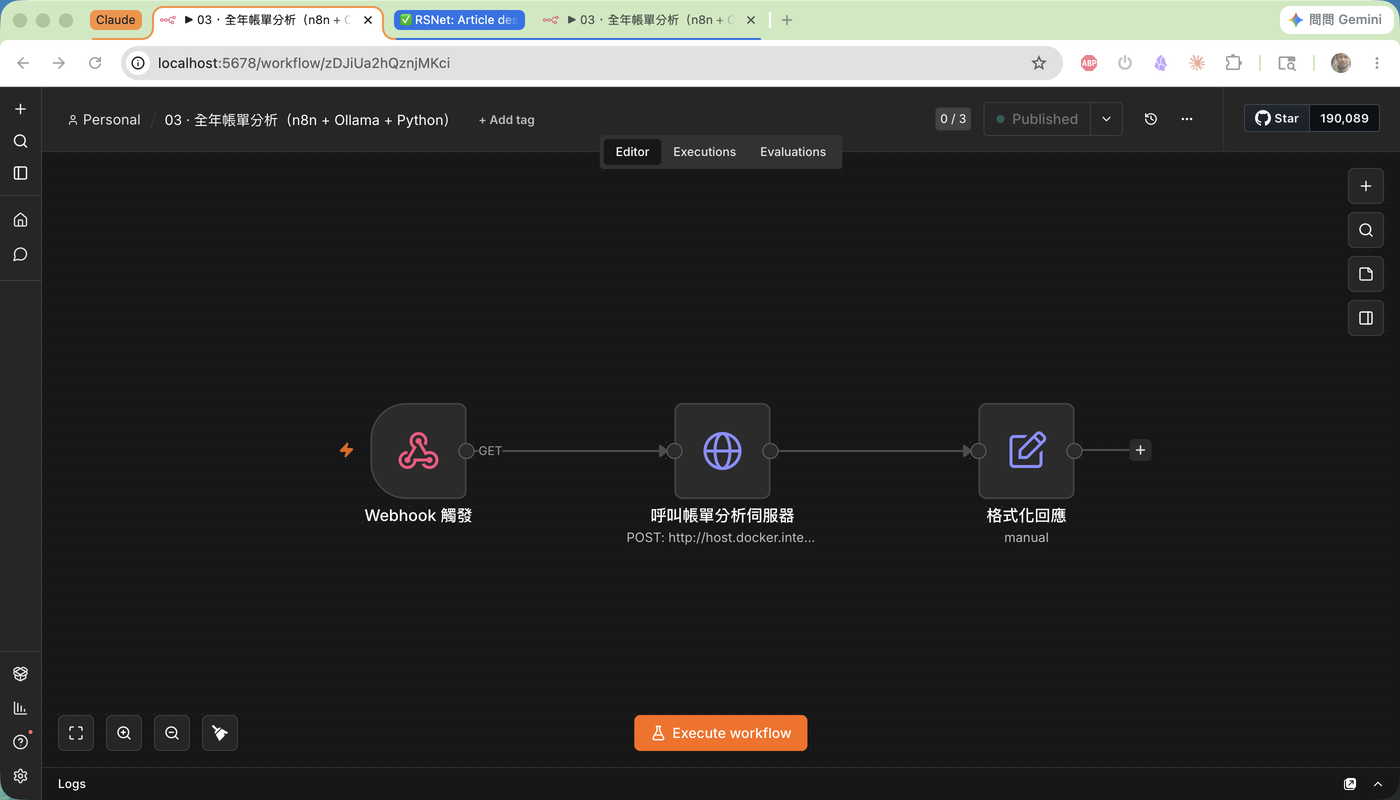
Webhook 觸發(GET /billing-annual)
    → HTTP Request(POST → Flask :5001/analyze)
    → Set 節點(整理回傳欄位)
Webhook 節點:接收 GET 請求,responseMode: lastNode 讓它等到最後一個節點完成才回應。
HTTP Request 節點:這個節點是關鍵。設定:
- Method: POST
- URL:
http://host.docker.internal:5001/analyze(從 Docker 容器連到本機) - Body:
{"year": "2026", "skip_ai": false} - Timeout: 30 分鐘(AI 分析需要時間,預設 5 分鐘會 timeout)
Set 節點:從 Flask 回傳的 JSON 裡取出 status、elapsed_s、summary.total_transactions 等欄位,讓回應更乾淨。
就這樣。n8n 這邊本身沒什麼複雜的,它只是一個觸發入口加上一個 HTTP 代理。
The n8n side: three nodes
Webhook trigger (GET /billing-annual)
    → HTTP Request (POST → Flask :5001/analyze)
    → Set node (clean up response fields)
Webhook node: receives the GET request. responseMode: lastNode holds the response open until the last node finishes — important when the pipeline takes minutes.
HTTP Request node: the critical one. Settings:
- Method: POST
- URL:
http://host.docker.internal:5001/analyze(container → host machine) - Body:
{"year": "2026", "skip_ai": false} - Timeout: 30 minutes (the default 5 minutes will time out before Ollama finishes)
Set node: extracts status, elapsed_s, summary.total_transactions from the Flask JSON response and reshapes it into something cleaner.
That's it. n8n's role here is thin by design — a trigger entry point and an HTTP proxy. The complexity lives in Python.
Python 的部分:三個腳本
帳單解析、分類、Excel 生成都在 Python 這邊處理,拆成三個腳本:
1. billing_parser.py:解析帳單
匯豐旅人御璽卡的帳單文字檔是這個格式:
匯豐旅人御璽卡
89,845 TWD
2025/12/03
連加*全聯福利中心台北民生東路
3,800 TWD
2025/12/05
APE*PARKING Taipei TWN
7,200 TWD
...
兩個坑:
第一個坑:全形字元。商家名稱全是全形 Unicode(ABC → ABC),需要先做全形轉半形再做任何比對。轉換邏輯就是把 0xFF01–0xFF5E 的字元往前移 0xFEE0:
def fullwidth_to_ascii(text: str) -> str:
    result = []
    for ch in text:
        code = ord(ch)
        if 0xFF01 <= code <= 0xFF5E:
            result.append(chr(code - 0xFEE0))
        elif ch == ' ':   # 全形空格
            result.append(' ')
        else:
            result.append(ch)
return ''.join(result)第二個坑:商家名稱後綴。很多停車場的名稱格式是 PARKING Taipei TWN,直接截掉地名後綴會變空字串。解法是只有截完之後還有剩才真的截:
stripped = re.sub(r'[A-Z]{2,}\s*$', '', name).strip()
if stripped:
    name = stripped
2. 分類規則:15 個類別
分類用關鍵字匹配,15 個類別,順序即優先級:
CATEGORY_RULES = [
    ('手續費',   '其他',    ['手續費', '國外交易']),
    ('訂閱服務', '個人數位', ['NETFLIX', 'DISNEY', 'KKBOX', 'SPOTIFY', 'GOOGLE', ...]),
    ('育兒教育', '育兒',    ['安親班', '才藝班', '游泳', 'LEGO', '夏令營', '學校', ...]),
    ('旅遊出行', '旅遊',    ['長榮航空', '華航', 'Agoda', 'Booking', '旅館', '飯店', ...]),
    ('交通停車', '日常交通', ['中油', '加油', 'PARKING', '停車', '捷運', '高鐵', ...]),
    # ... 共 15 類
]
比對邏輯很簡單:商家名稱轉大寫,逐一比對關鍵字,先匹配先贏。這份規則表調整了幾輪,目前 405 筆裡誤分類不超過 5 筆。
3. generate_excel.py:四個 Worksheet
輸出的 Excel 有四個分頁:
| 分頁 | 內容 |
|---|---|
| 全年明細 | 全部 405 筆交易,含日期、商家、金額、類別、用途 |
| 月趨勢 | 12 個月消費合計 + 折線圖 |
| 類別分析 | 各類別總額 + 長條圖 + 圓餅圖 |
| AI 分析摘要 | 每月 Ollama 摘要 |
圖表用 matplotlib 生成 PNG,再用 openpyxl 嵌進對應的 worksheet:
fig, ax = plt.subplots(figsize=(10, 5))
ax.plot(months, totals, marker='o', color='#3498DB', linewidth=2.5)
# ...儲存成 PNG 再 wb.add_image(img, 'A16')
The Python side: three scripts
All the parsing, classification, and Excel generation happens in Python — split across three scripts.
1. billing_parser.py: parsing statements
HSBC Traveller card statements arrive as plain text in this format:
匯豐旅人御璽卡
89,845 TWD
2025/12/03
連加*全聯福利中心台北民生東路
3,800 TWD
2025/12/05
APE*PARKING Taipei TWN
7,200 TWD
...
Two gotchas:
Gotcha 1: fullwidth Unicode. Merchant names come in fullwidth characters (ABC instead of ABC). You need to normalize these before any keyword matching. The conversion shifts codepoints in the 0xFF01–0xFF5E range back by 0xFEE0:
def fullwidth_to_ascii(text: str) -> str:
    result = []
    for ch in text:
        code = ord(ch)
        if 0xFF01 <= code <= 0xFF5E:
            result.append(chr(code - 0xFEE0))
        elif ch == ' ':   # fullwidth space
            result.append(' ')
        else:
            result.append(ch)
    return ''.join(result)
Gotcha 2: merchant name suffixes. Parking garages show up as PARKING Taipei TWN. Strip the country/city suffix naively and you're left with an empty string. Fix: only apply the strip if something remains afterward:
stripped = re.sub(r'[A-Z]{2,}\s*$', '', name).strip()
if stripped:
    name = stripped
2. Classification: 15 categories
Keyword matching against 15 categories, ordered by priority — first match wins:
CATEGORY_RULES = [
    ('手續費',   '其他',    ['手續費', '國外交易']),
    ('訂閱服務', '個人數位', ['NETFLIX', 'DISNEY', 'KKBOX', 'SPOTIFY', 'GOOGLE', ...]),
    ('育兒教育', '育兒',    ['安親班', '才藝班', '游泳', 'LEGO', '夏令營', '學校', ...]),
    ('旅遊出行', '旅遊',    ['長榮航空', '華航', 'Agoda', 'Booking', '旅館', '飯店', ...]),
    ('交通停車', '日常交通', ['中油', '加油', 'PARKING', '停車', '捷運', '高鐵', ...]),
    # ... 15 categories total
]
Merchant name is uppercased, then matched sequentially. After a few rounds of tuning, misclassification rate across 405 transactions is under 5.
3. generate_excel.py: four worksheets
| Sheet | Contents |
|---|---|
| 全年明細 (Full ledger) | All 405 transactions — date, merchant, amount, category |
| 月趨勢 (Monthly trend) | 12-month totals + line chart |
| 類別分析 (Category breakdown) | Per-category totals + bar chart + pie chart |
| AI 分析摘要 (AI summaries) | Monthly Ollama analysis |
Charts are rendered by matplotlib as PNG, then embedded into the worksheet via openpyxl:
fig, ax = plt.subplots(figsize=(10, 5))
ax.plot(months, totals, marker='o', color='#3498DB', linewidth=2.5)
# ...save as PNG, then wb.add_image(img, 'A16')
那個大坑:n8n Write Binary File 被封鎖
本來的設計是 n8n 直接寫 Excel 到本機路徑,省去一個 HTTP 端點。試了之後發現 n8n v2 在 Docker 環境下,Write Binary File 節點會擋掉所有本機路徑——不管是 /data、/tmp,還是 /home/node/.n8n/,全部「Not writable」。
這是 n8n v2 的安全設計,不是 bug。
解法是把檔案生成的邏輯全部移到 Flask 端點裡,n8n 只負責觸發,不碰 binary 資料。這也讓架構更清楚:n8n 是指揮,Python 是執行者。
另一個坑是 n8n Code 節點的沙盒限制:fetch 和 $helpers 都不可用,沒辦法在 Code 節點裡直接呼叫 Ollama。所以 Ollama 的呼叫也是在 Flask 端點裡用 Python requests 做的。
The big gotcha: n8n Write Binary File is blocked
The original design had n8n writing the Excel file directly to a local path — one less HTTP endpoint. Turns out n8n v2 in Docker blocks all local path writes from the Write Binary File node. /data, /tmp, /home/node/.n8n/ — all return "Not writable."
This is intentional security behavior in n8n v2, not a bug.
The fix: move all file generation into the Flask endpoint. n8n never touches binary data — it only fires the trigger and reads back JSON. Annoying to discover mid-build, but the resulting architecture is actually cleaner.
Second gotcha: the n8n Code node sandbox doesn't allow fetch or $helpers. No direct Ollama calls from inside a Code node. That's why the Ollama call also lives in the Flask endpoint, using Python's requests.
結果:全年 NT$847,538
405 筆交易,全年消費 NT$847,538,平均每月 NT$70,628。
類別分析:育兒吃掉三分之一
| 類別 | 全年金額 | 佔比 |
|---|---|---|
| 育兒教育 | NT$288,980 | 34.1% |
| 交通停車 | NT$133,020 | 15.7% |
| 超市量販 | NT$128,866 | 15.2% |
| 餐飲 | NT$79,500 | 9.4% |
| 旅遊出行 | NT$74,050 | 8.7% |
| 百貨購物 | NT$41,660 | 4.9% |
| 其他 | NT$27,028 | 3.2% |
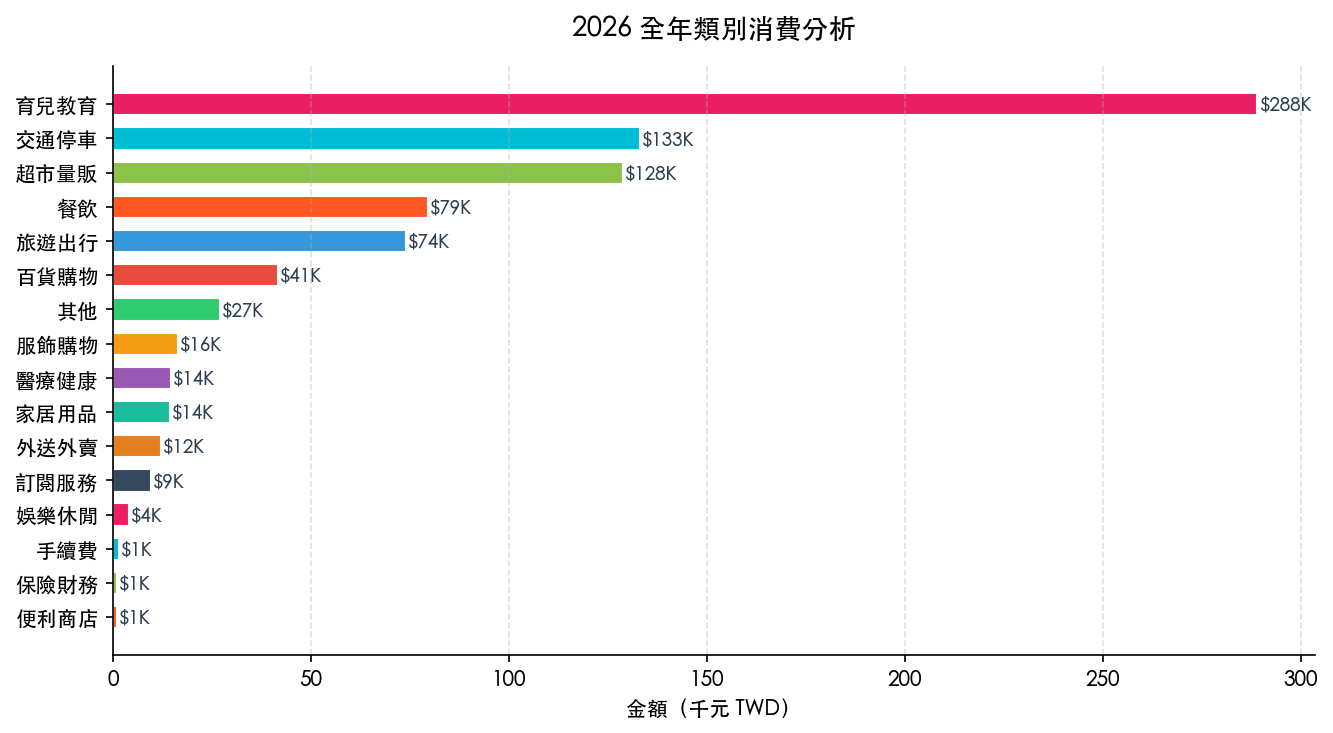
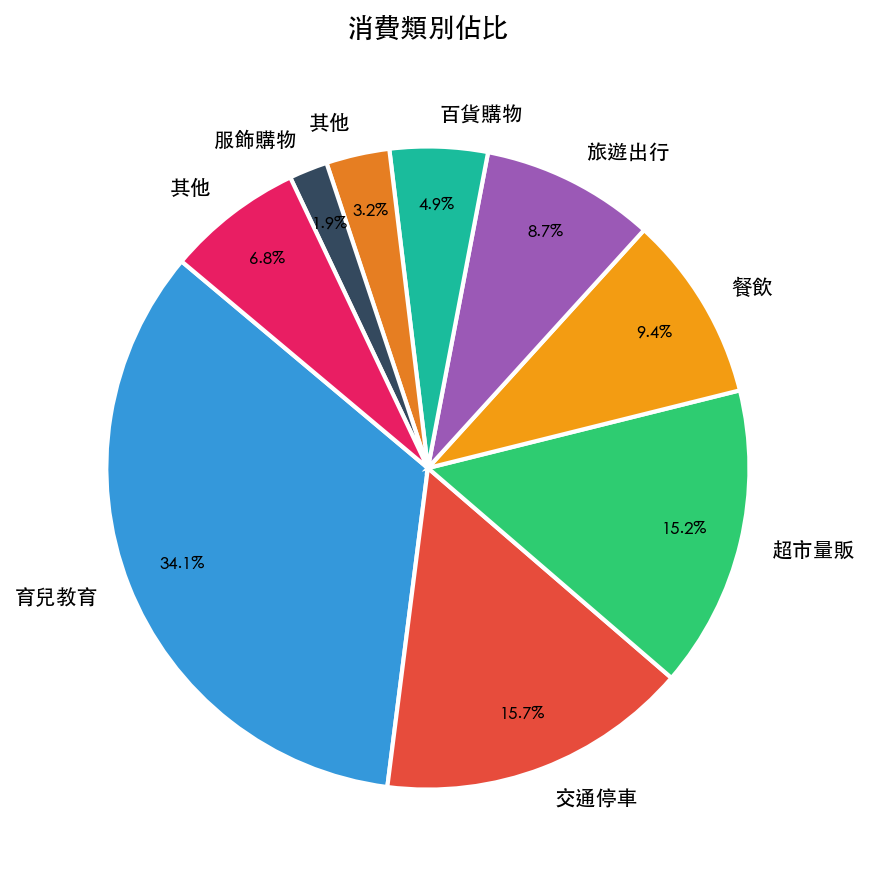
育兒教育一個人就佔 34.1%。細看裡面:安親班月費(三個孩子)NT$165,000、游泳才藝班 NT$36,000、鋼琴 NT$17,500。這三項加起來就是 NT$218,500,幾乎是全年總花費的四分之一。
交通停車第二,NT$133,020。停車場 NT$86,400(全年平均每月 NT$7,200),加上中油兩個加油站合計 NT$36,890。台北開車的成本,數字攤開來比感覺貴很多。
超市量販第三,NT$128,866。COSTCO NT$49,330 + 全聯 NT$38,000 + 家樂福 NT$24,446。好市多的年費確實賺得到。
月趨勢:三個高峰都有理由
| 月份 | 金額 | 原因 |
|---|---|---|
| 2026-08 | NT$109,248 | 暑假出遊:長榮航空 NT$32,500 + Agoda NT$8,500 + 夏令營 |
| 2026-02 | NT$90,309 | 農曆年:旅遊 NT$19,100 + 過年採購 |
| 2026-12 | NT$89,845 | 年終購物:百貨購物 NT$22,550 + 才藝課 |
| 2026-01 | NT$72,832 | 年初開銷 |
| 2026-03 | NT$43,288 | 最低月,生活趨於平靜 |
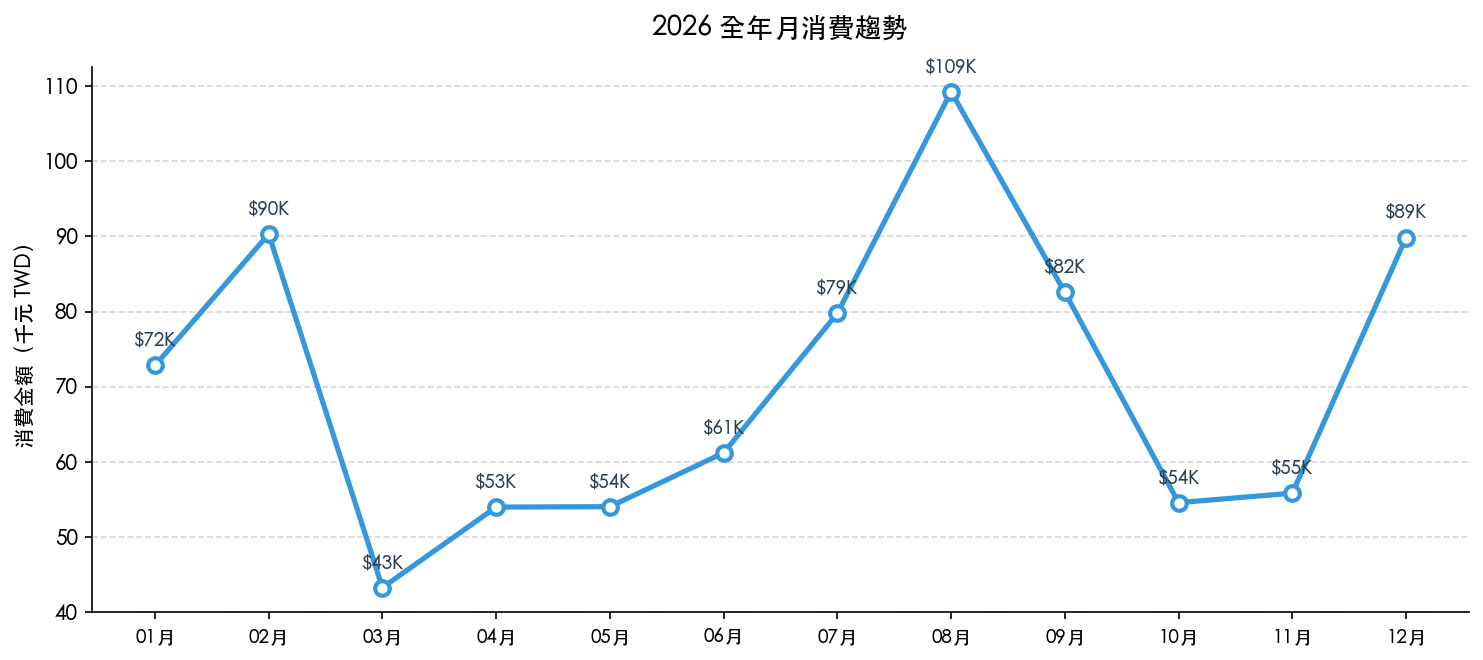
8 月是最高峰,不是因為日常支出暴增,而是一趟家庭旅遊讓整個月的數字往上推。把旅遊類單獨抽出來,8 月的「日常消費」其實很正常。
9 月的數字(NT$82,555)高,主要是開學:新書包書桌文具 NT$8,500、學校注冊雜費 NT$4,500、暑假夏令營尾款——這些在 8 月底/9 月初一次出現。
訂閱服務:NT$9,468 一年
| 服務 | 全年 |
|---|---|
| Netflix | NT$3,480 |
| Disney+ | NT$2,520 |
| Google One | NT$2,280 |
| KKBOX | NT$1,188 |
四個訂閱合計 NT$9,468。這個數字比我想像的低,因為一部分訂閱是用 Apple 家人分享共攤。
Results: NT$847,538 for the year
405 transactions. NT$847,538 total. NT$70,628 monthly average.
Category breakdown: childcare takes a third
| Category | Annual | Share |
|---|---|---|
| Childcare & education | NT$288,980 | 34.1% |
| Transport & parking | NT$133,020 | 15.7% |
| Supermarkets | NT$128,866 | 15.2% |
| Dining | NT$79,500 | 9.4% |
| Travel | NT$74,050 | 8.7% |
| Department stores | NT$41,660 | 4.9% |
| Other | NT$27,028 | 3.2% |
Childcare alone accounts for 34.1%. Breaking it down: after-school programs for three kids — NT$165,000. Swimming and music lessons — NT$53,500. Those three line items total NT$218,500, nearly a quarter of the full year's spend.
Transport and parking comes second at NT$133,020. Parking garages alone: NT$86,400 (NT$7,200 per month on average). Add two gas stations at NT$36,890. Driving in Taipei costs more than it feels like it does until you see it itemized.
Supermarkets third at NT$128,866. Costco NT$49,330 + PXMart NT$38,000 + Carrefour NT$24,446. The Costco membership pays for itself.
Monthly peaks: each one has a reason
| Month | Amount | Driver |
|---|---|---|
| Aug 2026 | NT$109,248 | Summer trip: EVA Air NT$32,500 + Agoda NT$8,500 + camp fees |
| Feb 2026 | NT$90,309 | Lunar New Year: travel NT$19,100 + holiday shopping |
| Dec 2026 | NT$89,845 | Year-end shopping: department stores NT$22,550 + lessons |
| Jan 2026 | NT$72,832 | Start-of-year expenses |
| Mar 2026 | NT$43,288 | Lowest month — quiet period |
August's spike isn't runaway daily spending — it's one family trip pushing the whole month up. Strip out the travel category and August looks normal.
September (NT$82,555) is high because of back-to-school: new backpack, desk, stationery NT$8,500 + school registration fees NT$4,500 + summer camp balance payments. All concentrated in late August / early September.
Subscriptions: NT$9,468 for the year
| Service | Annual |
|---|---|
| Netflix | NT$3,480 |
| Disney+ | NT$2,520 |
| Google One | NT$2,280 |
| KKBOX | NT$1,188 |
Four subscriptions, NT$9,468 total. Lower than expected — several are split through Apple Family Sharing.
Ollama 分析的品質
每個月的 Ollama 分析大約 80–120 字,用繁體中文台灣用語。Prompt 設計是把類別統計和前 12 筆高消費一起餵進去:
請務必使用繁體中文台灣用語回答。

以下是台灣家庭 2026-08 信用卡消費(共 35 筆,合計 NT$109,248)。

類別合計:
  旅遊出行 NT$54,950、育兒教育 NT$13,500、超市量販 NT$10,960、交通停車 NT$9,160

最高消費前 12 筆:
  2026/07/04 長榮航空...   NT$ 32,500 [旅遊出行]
  2026/07/06 暑期夏令營第一週費用   NT$  9,000 [育兒教育]
  ...

請以 80 字以內分析:1) 本月消費特色 2) 值得注意的支出 3) 一句建議。
直接分析,不要分點,不要重複數字。
8 月的分析輸出:
本月消費最主要的特色是旅遊出行與育兒教育支出佔了總額的比例最高。值得注意的是單筆航空費用相當高,建議未來規劃旅遊行程時,應更精準預算,避免預期外的旅遊開銷。
這個品質算合理。它抓到了月份的主要特色,建議也切中要點。
有一個問題:12 個月的分析建議有點重複——每個月都說「建議規劃更精準的預算」,措辭換來換去但核心一樣。這是因為消費結構本來就很穩定,每個月的固定支出佔了大頭,AI 能講的東西有限。
如果想讓分析更有變化,可以在 prompt 裡加「相比上個月的差異是什麼」,讓模型做月份比較。這個版本先沒做,留著下次改進。
Ollama analysis quality
Each month's summary comes out at 80–120 characters in Traditional Chinese. The prompt feeds in both the category totals and the top 12 transactions by amount:
請務必使用繁體中文台灣用語回答。

以下是台灣家庭 2026-08 信用卡消費(共 35 筆,合計 NT$109,248)。

類別合計:
  旅遊出行 NT$54,950、育兒教育 NT$13,500、超市量販 NT$10,960、交通停車 NT$9,160

最高消費前 12 筆:
  2026/07/04 長榮航空...   NT$ 32,500 [旅遊出行]
  2026/07/06 暑期夏令營第一週費用   NT$  9,000 [育兒教育]
  ...

請以 80 字以內分析:1) 本月消費特色 2) 值得注意的支出 3) 一句建議。
直接分析,不要分點,不要重複數字。
August's output (translated):
This month's spending is dominated by travel and childcare education. The single airline ticket stands out as a high-value item — future trip planning would benefit from more precise budgeting to avoid unexpected travel costs.
Reasonable quality. It correctly identifies the month's dominant pattern and the recommendation is on point.
One consistent weakness: across all 12 months, the advice converges on some variation of "budget more carefully." The wording shifts but the core is the same. This makes sense — spending structure is stable, fixed costs dominate, and there's only so much the model can say about a pattern that doesn't change.
The fix would be adding "compared to last month" context to the prompt — force the model to describe the delta, not just the state. I left this for a future iteration.
效能
整個流程跑在 MacBook M1 16GB:
| 環節 | 耗時 |
|---|---|
| 解析 12 份帳單 | < 1 秒 |
| Ollama 分析 12 個月 | 約 172 秒(平均 14.3 秒/月) |
| 生成 Excel + 圖表 | 約 12 秒 |
| 全程總計 | 184 秒 |
gemma4:e2b 在 M1 16GB 上跑,記憶體佔用約 7GB,每月分析約 14 秒。12 個月連跑下來不到 3 分鐘,比我預期快很多。
沒有 GPU,純 CPU 推論,速度還是夠用。
Performance
Running on MacBook M1 16GB:
| Stage | Time |
|---|---|
| Parse 12 statements | < 1 second |
| Ollama analysis, 12 months | ~172 seconds (14.3 s/month average) |
| Generate Excel + charts | ~12 seconds |
| Total | 184 seconds |
gemma4:e2b on M1 16GB peaks at around 7GB RAM usage. Fourteen seconds per monthly summary, twelve months in a row, under three minutes total. Faster than I expected from a CPU-only inference run.
No GPU. Pure CPU. Still fast enough.
要不要做這個
如果你只是想整理一份帳單,直接用 Excel 手動貼比較快。
這套流程適合的情境:
- 帳單格式固定、每個月都要重複處理
- 不想把財務資料傳到任何雲端服務
- 希望有 AI 摘要但不想付 API 費用
- 已經有 n8n 或想試試 n8n 的人
要有的東西:n8n(Docker 就好)、Ollama(下載 gemma4:e2b)、Python 3.12+(openpyxl + matplotlib)。
三個工具的設定時間加起來不超過 30 分鐘。之後每次跑只要按一個 webhook,等三分鐘。
Scripts 放在 tests/scripts/,帳單格式參考 tests/data/ 裡的文字檔範本。
Should you build this
If you have one statement to sort through, just open a spreadsheet.
This pipeline makes sense when:
- Your statement format is consistent and you'll process it every month
- You don't want financial data hitting any cloud service
- You want AI summaries but not the API bill
- You already use n8n or have been looking for an excuse to try it
What you need: n8n (Docker is fine), Ollama (pull gemma4:e2b), Python 3.12+ (openpyxl + matplotlib).
Total setup time across all three tools: under 30 minutes. After that, one webhook trigger, three minutes, done.
Scripts are in tests/scripts/. Statement format reference in tests/data/.